Do you feel heavy after opening GA4 and wondering how on earth you will make sense of it? No worries, many have felt the same.
By the end of this Google Analytics 4 tutorial, you will be well on your way to becoming skilled in GA4, even if you are a beginner in this tool.
This article will guide you step-by-step through setting up GA4, tracking events, and leveraging its reports to drive results. By the end, you’ll have a solid understanding of how to install GA4 with Google Tag Manager and track key metrics.
Table of Contents
How to install GA4 with Google Tag Manager
We will skip creating a GA4 account and other more straightforward steps during the process, as the article would be too long for mortals to bear.
So before starting this step, make sure you have created a Google Analytics 4 account.
However, let’s start with the basics: creating your GA4 property, installing it via Google Tag Manager, and verifying that it’s working correctly.
Create Google Analytics 4 Property and Data Stream
How to Create a Google Analytics 4 Property and Data Stream
To start collecting data in GA4, you must create and connect a property to a data stream.
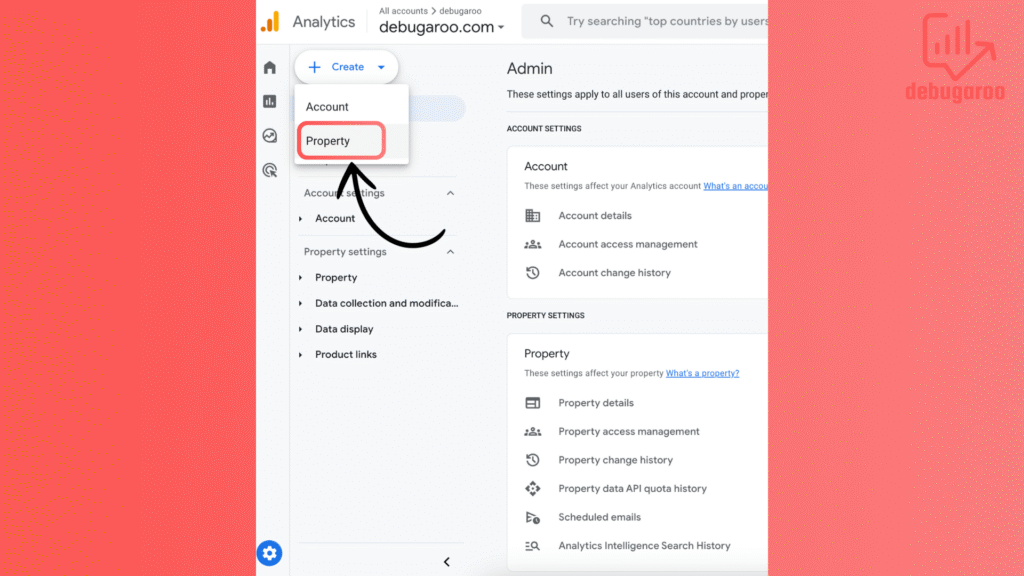
Log in to Google Analytics 4 account and go to the Admin section (Gear icon located in the lower left corner)

Click Create property under the Account column.
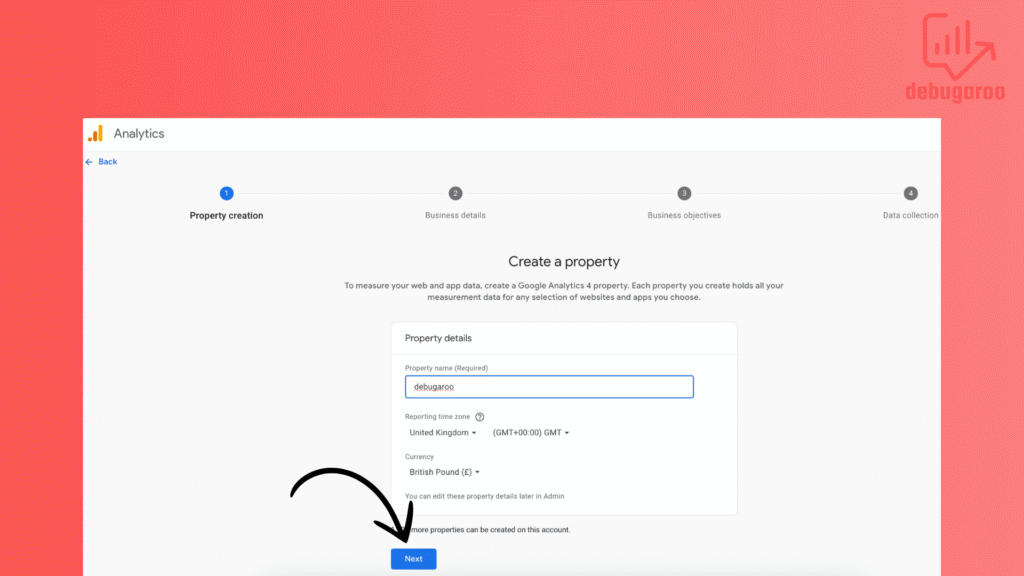
Fill in property Details: Enter a name for your property, for example, “debugaroo.com” or “my website”, select your time zone and currency, click next to proceed.
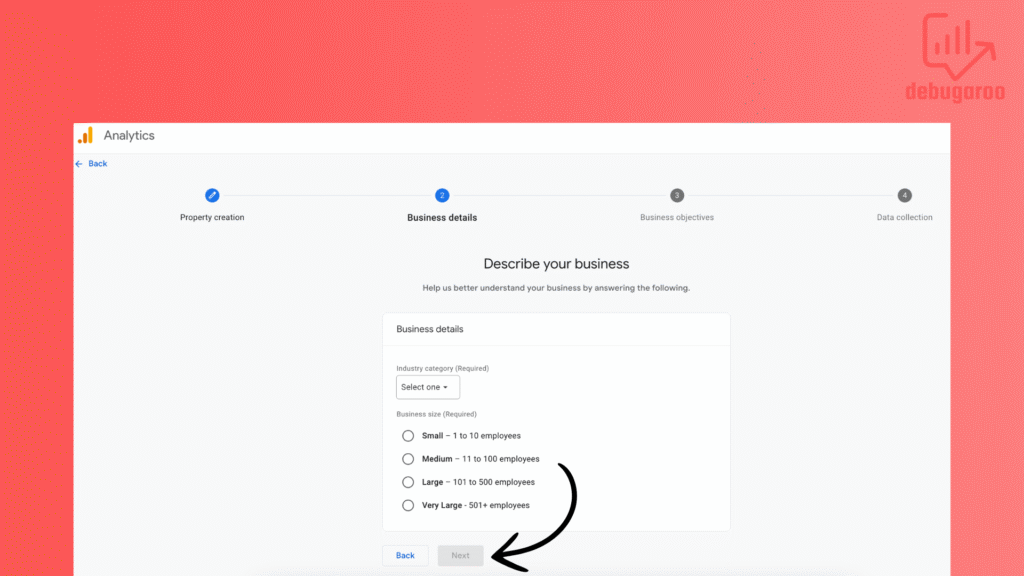
Fill in business details and hit next
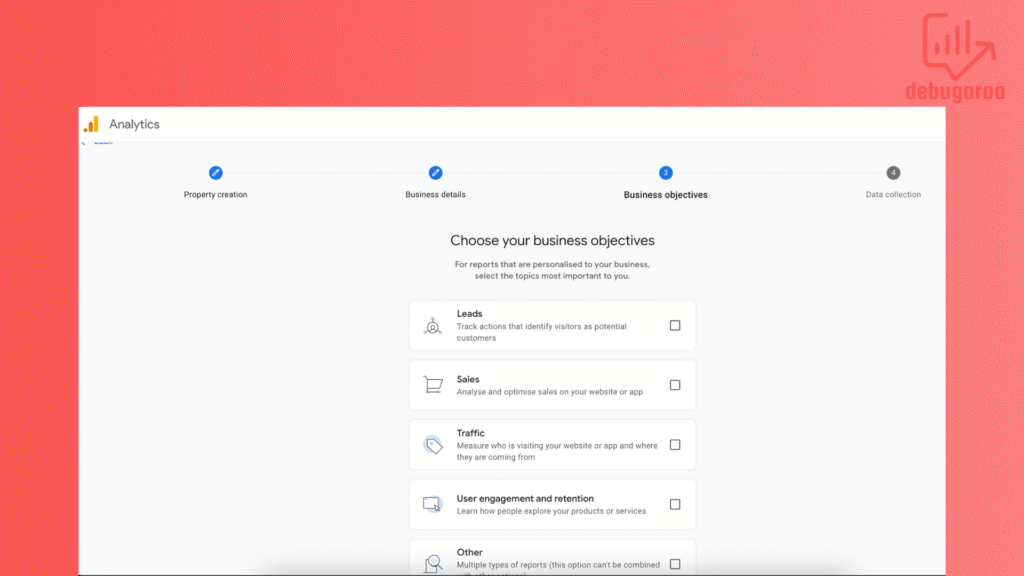
Choose a business objective based on your business. For example, choose Lead if you have a Saas company that focus on B2B customers, and sales as an e-commerce business. Or whatever suits you. It can be modified later.
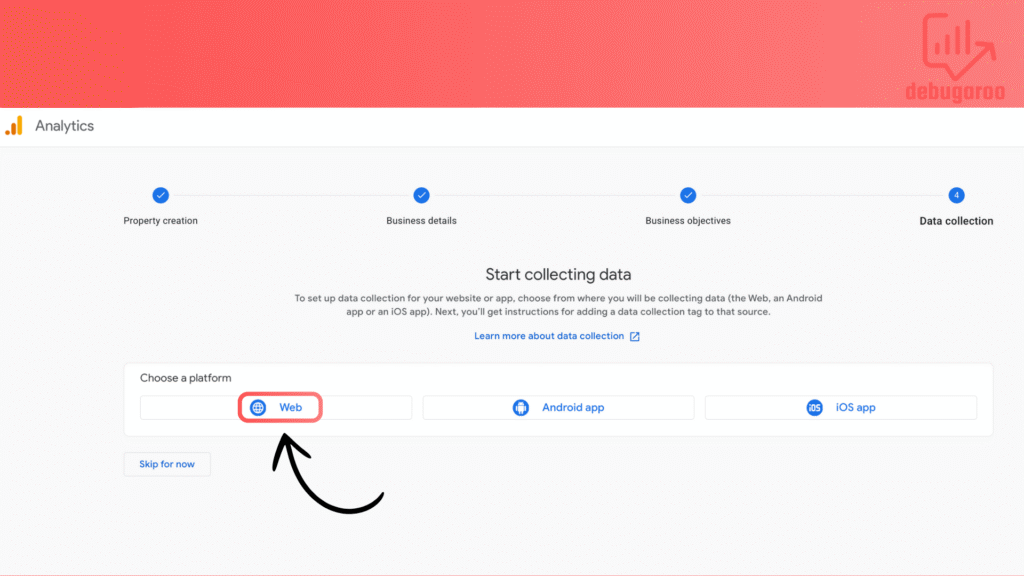
In this tutorial we focus on web stream. Choose Web platform.
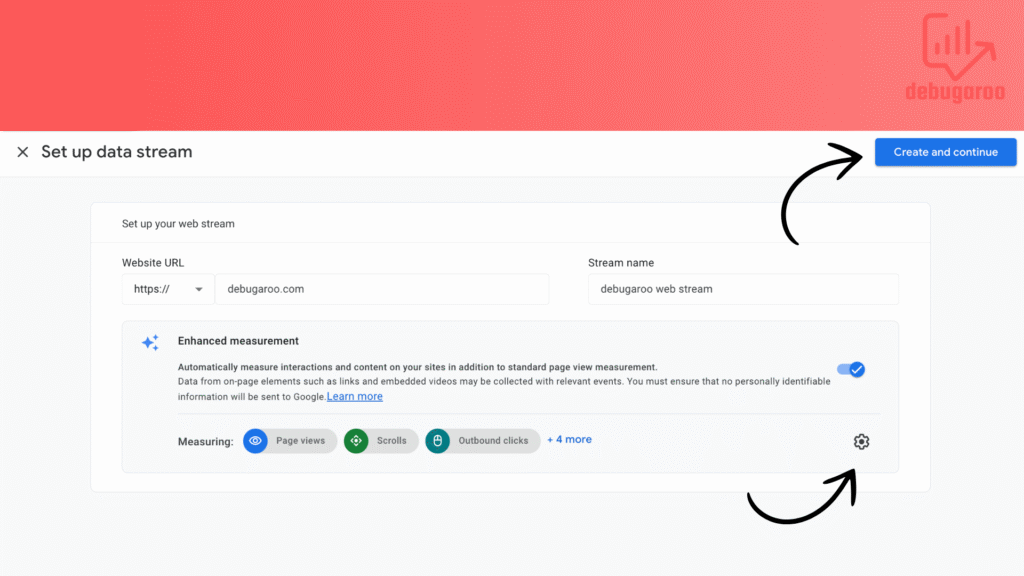
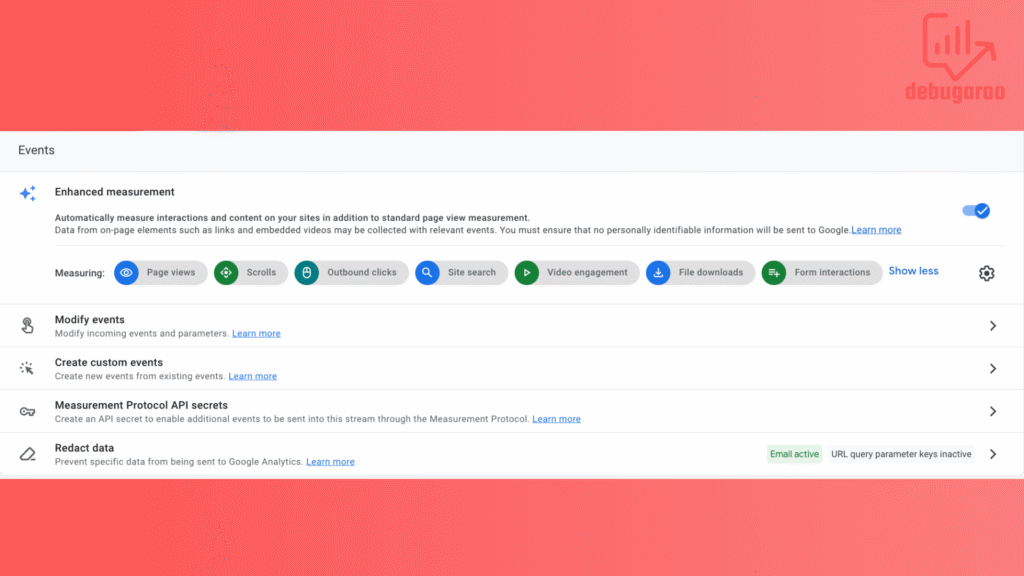
You can enable or disable enhanced measurement at any time. It’s enabled by default but you can change this even after you go through this setup. This configuration is created to help marketers capture a range of events like pageviews and outbound clicks, without needing to collaborate with developers or configure events in Google Tag Manager
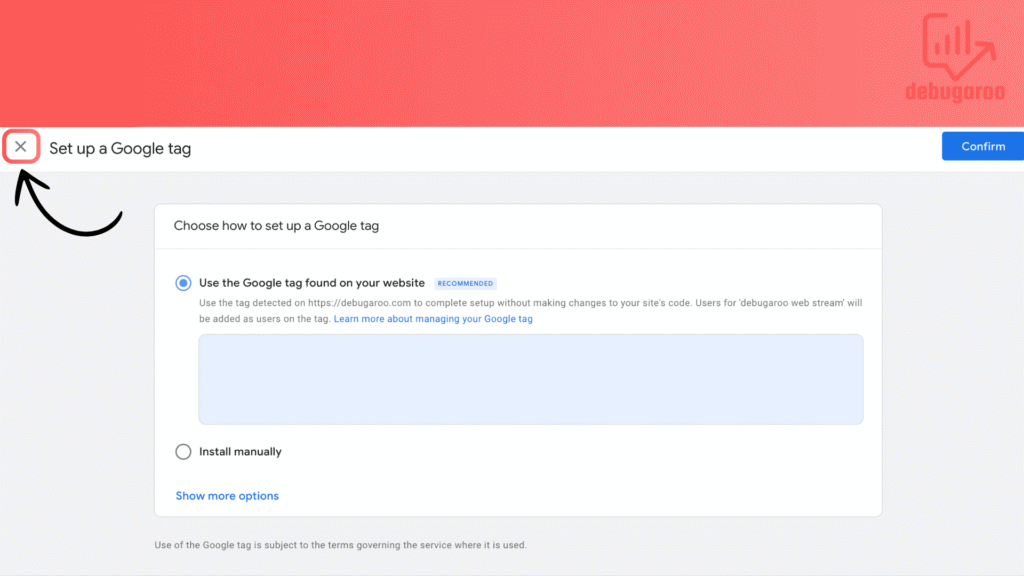
You can ignore this step as we will install GA4 via Google tag manager
Proceed
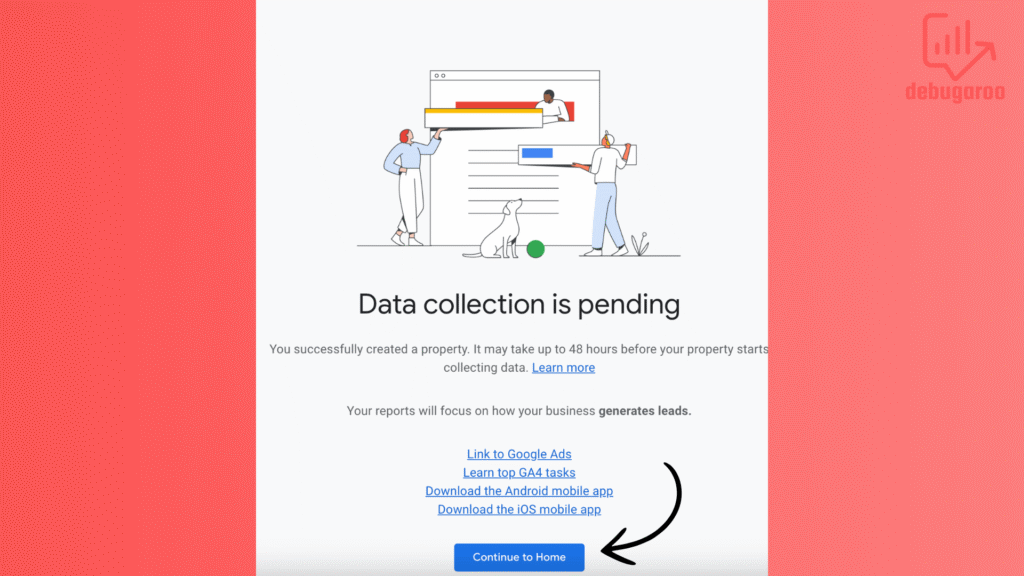
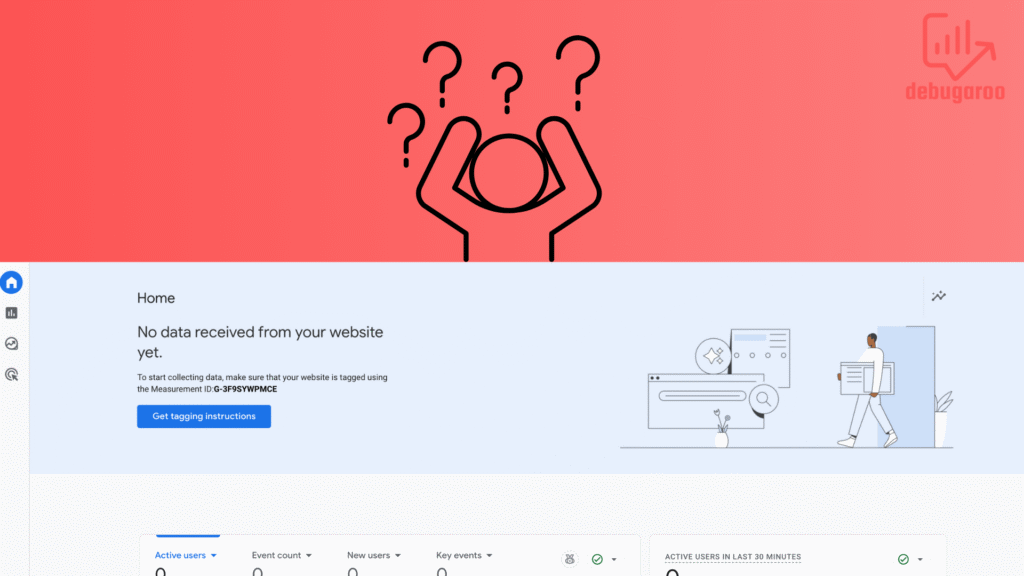
Nice! You have come far in the setup. Once the property and data stream are set up, you’ll receive a Measurement ID, a unique identifier that connects GA4 to your website. We’ll get to that in a moment. Now, we’re going to proceed and install GA4 with GTM. You will soon get your first page_view.
Install Google Analytics 4 with Google Tag Manager
In GA4– Head to Admin section (Gear icon located in the lower left corner) then go to Data streams(1), Now choose the stream you just created and copy the Measurement ID(2). Save it for later.

Now, you go to Google Tag Manager. As previously stated, this article will not explain how to create a GA4 or a GTM account.
Create a new tag, select Google Analytics, and then Google Tag. Then, fill in the Tag ID with the Measurement ID you copied from GA4. For Triggering, choose Initialization on all All Pages, and name the tag as you wish.
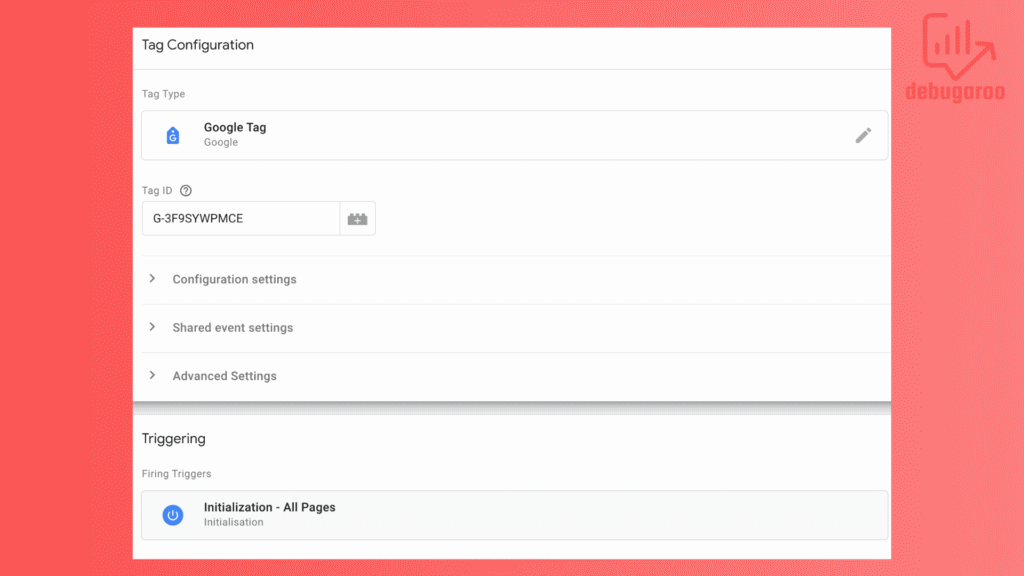
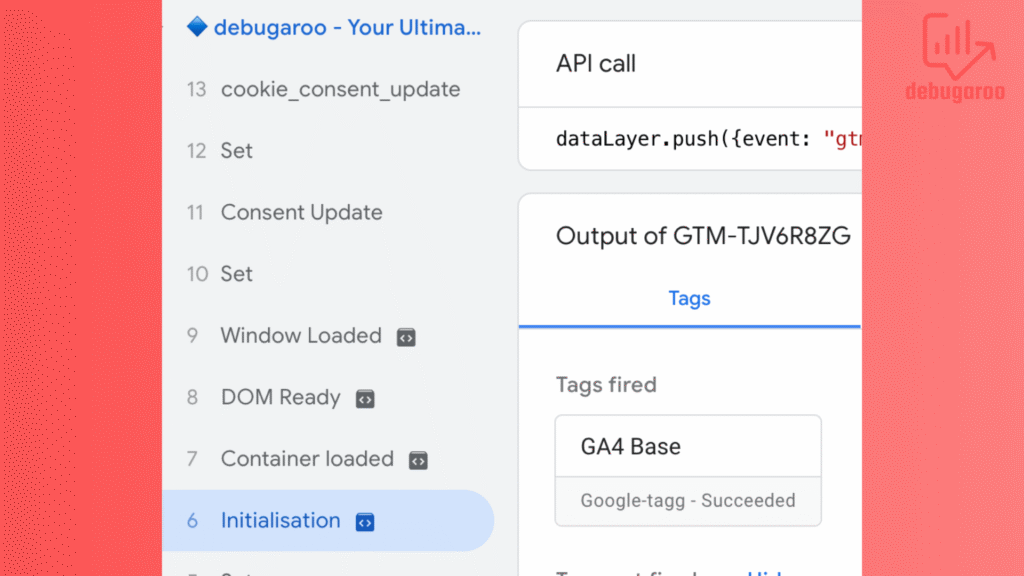
Check that the tag was firing to ensure the data was sent to GA4.
Enable Google Tag Manager preview mode by clicking the large preview- button in the upper right corner. Once you’ve enabled it, you should see the new Google tag.
DebugView in GA4
Now that you have configured your Google Tag, it’s time to test and see if it works(which you need to do with all GA4 events you set up). The prior feature for debugging GA4 data is in the debugview area. You can access it by going to Admin (gear icon down the left), click on DebugView.
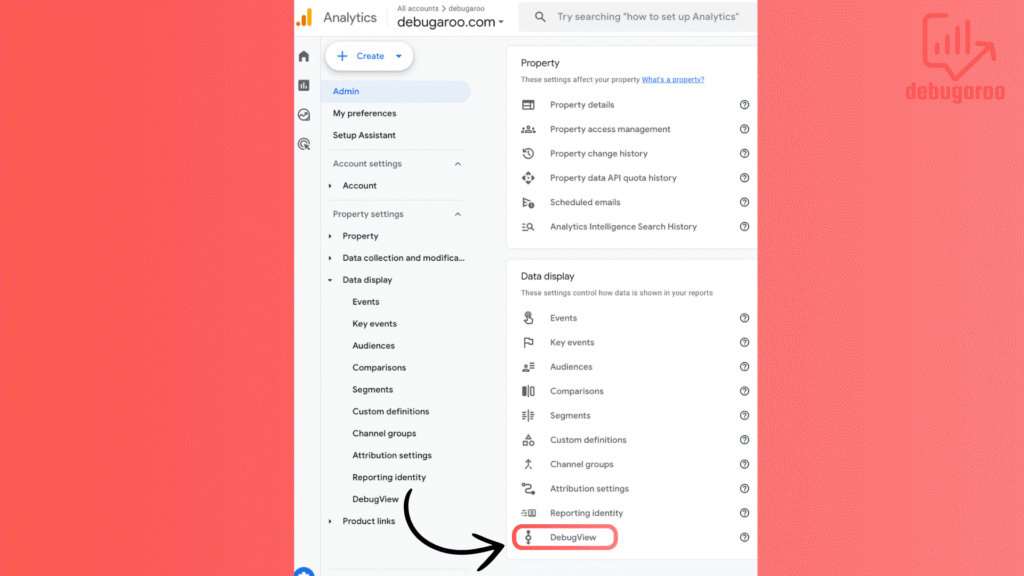
You will likely not see any data by just going in and clicking on debugview. In most cases, you need to enable debugview. We won’t go in-depth into it here, but here are 1 quick tip.
Use GA4 debugger Chrome Extension
When you install this Chrome extension. Open a browser window and go to the website you installed GA4 on. Click on the GA4 debugger chrome extension at the top of the toolbar (next to the address bar; it should say ON above the icon.
Like this:

Open a new browser window, go back to the GA4 interface, and go on to debugview. Now, you should start seeing the events coming in. You can go back to the browser window with the homepage and refresh the page or visit other pages.
Now, go back to the GA4 interface.
When you see events (refresh if you don’t see any), they start popping up in debugview, and you can click on them to see different parameters with values. You can, for example, see which page the event took place on, or as in the image here, we will see which page title the event took place on.
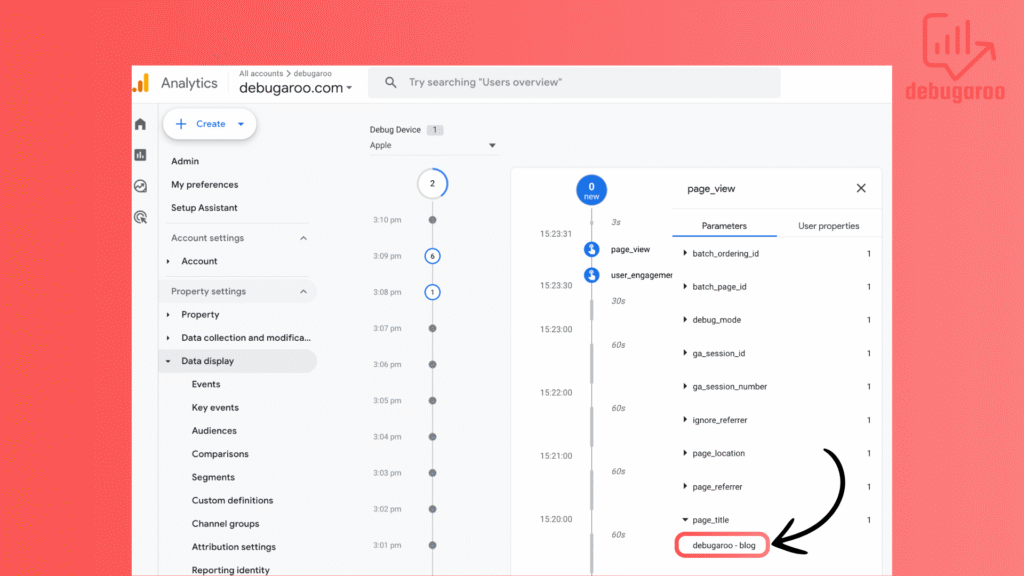
Now that you have seen that the events appear correct, you need to publish your work in Google Tag Manager. You do this by going to the GTM interface and, in the top right corner, click submit.
How To Track Events In Google Analytics 4
First, we need to talk about the difference between GA4 and Universal Analytics data model. The primary difference between them is in their approach to data collection. GA4 adopts an event-based data model, where every user interaction—whether a pageview, button click, scroll, or video play—is recorded as an event.
Unlike Universal Analytics, which had a session-based model that organized data around sessions, GA4 allows more flexibility in tracking and understanding user behavior, providing more context for the user journey. Events in GA4 can also include additional parameters, enabling more deep analysis and customization.
GA4 events are categorized into four types.
Automatically Collected Events: GA4 tracks predefined events by default, such as page_view or first_visit, requiring no additional setup. Use these to cover basic user interactions.
Enhanced Measurement Events: These expand on automatically collected events and include interactions like scrolls, file downloads, and outbound link clicks. In your data stream, this setting can be enabled with a toggle. They are for tracking standard website engagement without manual tagging. In our opinion, you should not fully trust that they are working properly, especially form interaction.
Screenshot from enhanced measurement in GA4 data stream settings
Recommended Events
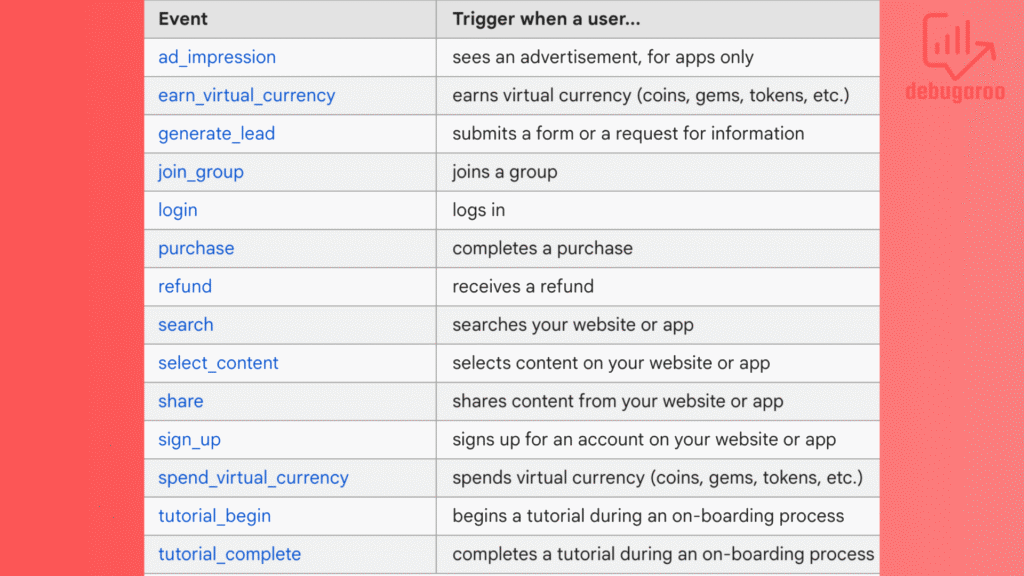
Predefined but not automatically tracked, such as purchase or sign_up. Use these for specific actions that align with common business objectives, ensuring uniformity across analytics reports.
Heres a list of recommended event.
Custom Events: These are designed for unique actions not covered by other event types, such as interactions specific to your site or app. Ensure proper naming convention and parameter usage to avoid overcomplicating reporting. We always advocate setting up events via Google Tag Manager instead of using manual scripts in the code or a CMS. With GTM, we get more control and have all tracking in the same place, and it is, in our opinion, more reliable than the previously mentioned ways.
Where To Find Events in GA4 Reports
Examples of reports where you can find your event data:
Explore (Exploration reports)
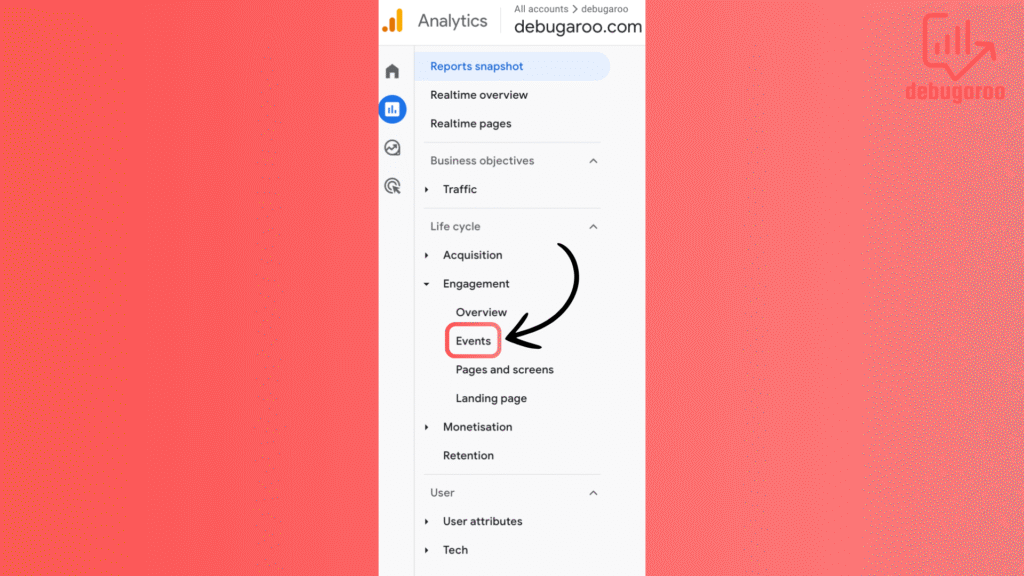
Engagement report
Admin – events: there is a list of all events
Side note: As mentioned above regarding the difference between GA4 and Universal Analytics, GA4 is an event-based platform. Basically, every report will be affected by the events you send. The reports above are just the most common examples.
Tracking Key Events in GA4
Key events, formerly known as “conversions,” represent high-value actions you want users to take.
Key events are like any other event; the difference is that they are configured in GA4 to be included in the ‘Key Events’ list. This means you should configure Key Events for your most crucial actions that you want your website visitors to do. They are generally tied to your business goals. Here are some examples of events that a lot of businesses has toggled as Key Events:
- generate_lead
- sign_up
Predefined key events.
There are some predefined Key Events in GA4. The only one that applies to the web stream is the purchase event, the other predefined key events are related to app tracking.
Mark event as key event.
In this guide, we will not explain how to create a custom event. You can create a custom event directly in the GA4 interface, but we prefer to create a dedicated event using Google Tag Manager. We will go through that in the Google Tag Manager article, but here’s a quick look at how you mark an event as a key event.
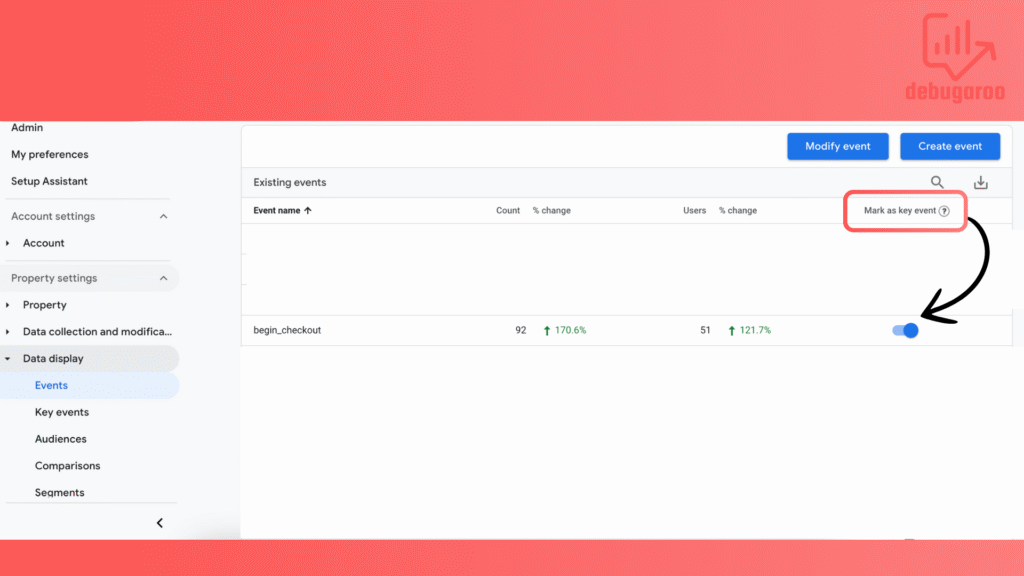
Go to Admin – Data display, then Events. Switch the toggle next to the crucial event for your website.
In this example, we have an event called begin_checkout, then you can toggle the switch and mark it as a key event. The change to key event will apply only to the new data. The events that were collected before will not convert to key events retroactively.
If you have just created an event, you must wait at least 24 hours before it appears in the event list.
Where to Find Key Events in GA4 Reports
Key event data is available in several places in GA4, depending on what you’re looking for.
If you just want to check which events you have marked as key events, follow the information above: go to admin, data display, and then key events.
You can also find key events in various reports in the GA4 interface.
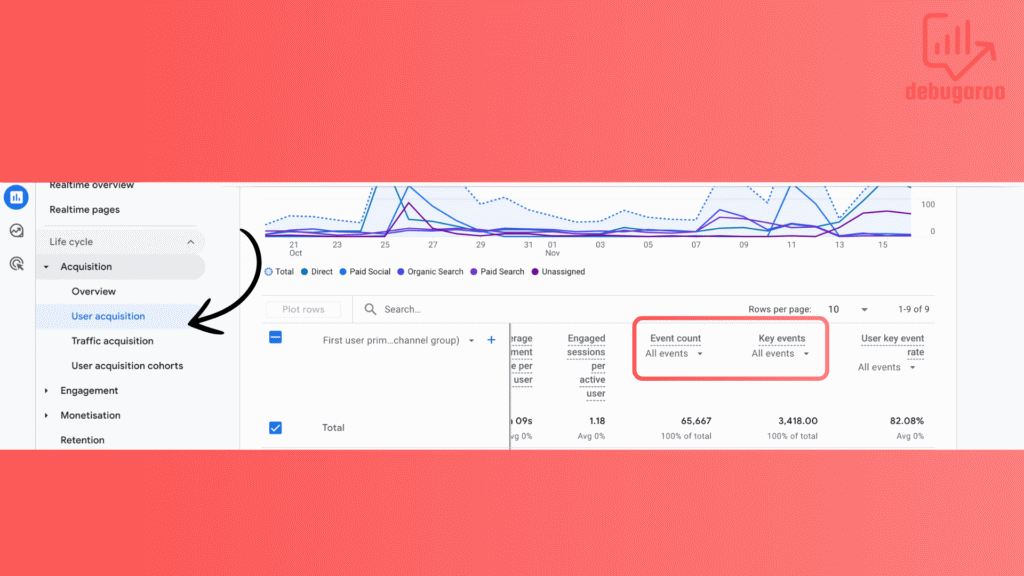
For example. Under the Acquisition report, you will find Traffic Acquisition and User Acquisition. Inside that report, you can see both regular events and key events.
Reports in Google Analytics 4
Standard reports
Realtime Report.
We’re not going to talk much about this one, but here is a short brief. It’s for monitoring live activity on your website during the previous 5 or 30 minutes, which you can also see on a per-minute basis. Sometimes, there are delays for the data to flow in.
Google Analytics 4 is basically built around two key reporting sections: Standard Reports and Explore (Exploration report),
Standard Reports in GA4
Key metrics and data points can be viewed quickly. These pre-made dashboards, with diagrams and tables, give immediate insights into your website performance.
Explorations are designed for those who want more flexibility and depth in the analysis. They allow you to build custom reports, analyze data, and uncover more detailed insights.
The reports available in GA4 depend on the business objective selected during your property’s setup. If you choose the “Get baseline reports” option, your property includes the Life Cycle collection, which gives you a broad viewpoint of the website visitor journey, from acquisition to retention.
Alternatively, when you created your GA4 account and got to choose a business objective, and you did chose a specific objective rather than the baseline report objective. That choice customizes reports to align with specific goals while retaining many reports in the Life Cycle collection.
You also have user collection besides the standard report and exploration reports. As it sounds, this collection is focused on the people browsing your website. The report contains information about demographics like gender and age and the technologies they use, such as browsers and devices.
Below are reports in the Life Cycle collection
Acquisition Reports
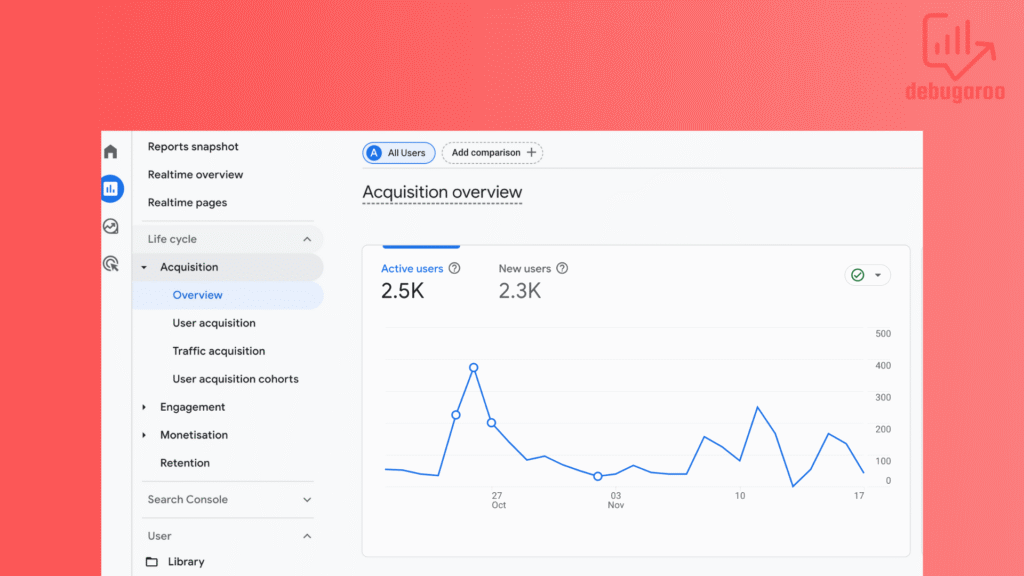
This report helps you understand where your users are coming from and what’s driving traffic to your website.
The report breaks down channels, sources, and mediums that drive visitors, such as Google organic, direct, social media, referral links, paid ads, etc. It’s a straight way to see which marketing actions are most effective in attracting users. It can also provide more insights into how different traffic sources perform over time.
Engagement Reports
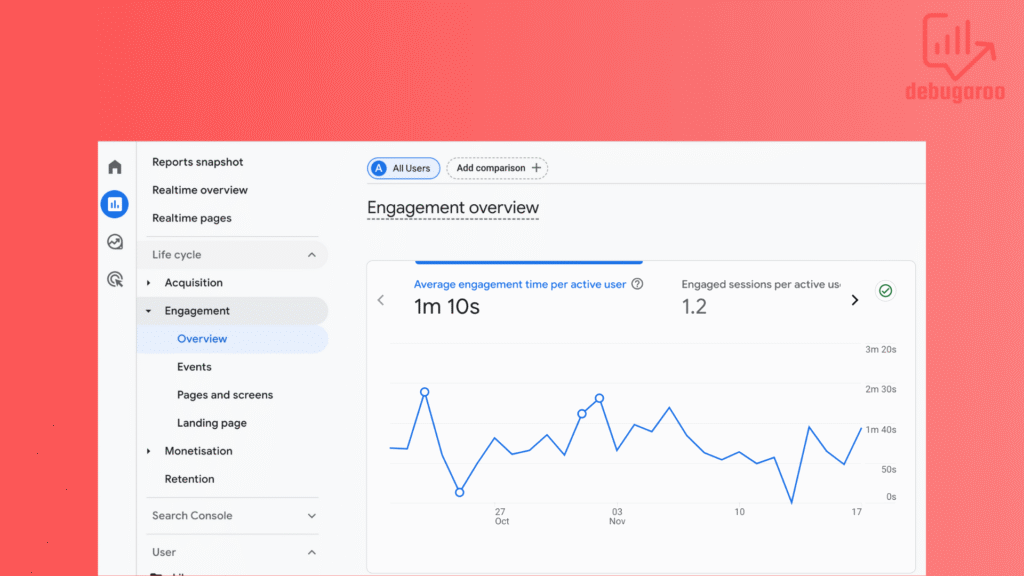
This reports highlight what users do once they land on your webpage.
It contains Overview, Events, Conversions, Pages and screens, and Landing page reports. These reports provide a broad overview of user interaction, from the pages users visit to the buttons they click.
Track content, analyze landing pages, and gain optimization ideas. Also, track a blog post and its interaction, event count, etc. It can help your business improve user experience and get more engagement.
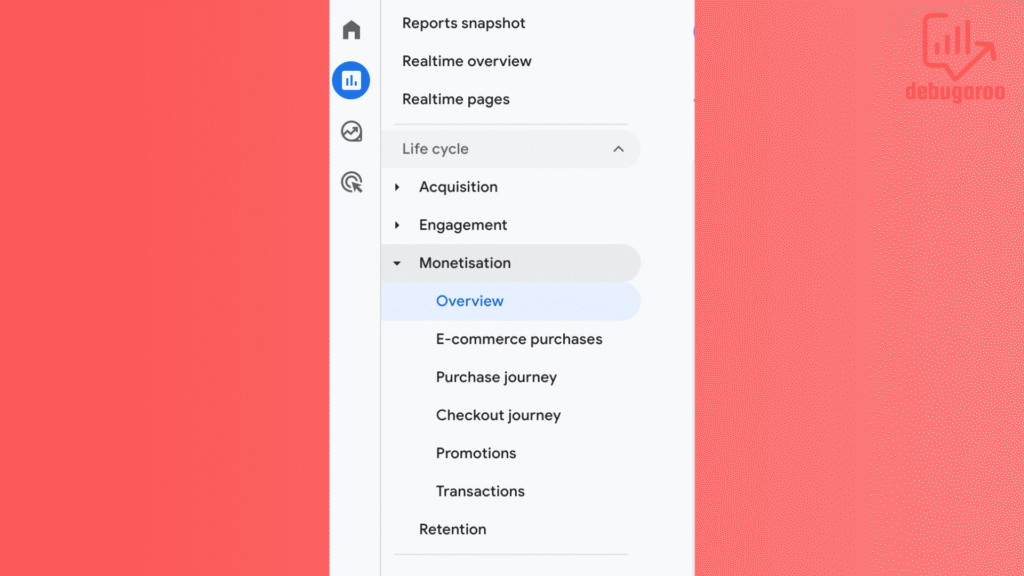
Monetization Report
Tracking and understanding your revenue streams and product performance. It shows metrics like total revenue and purchases. It’s primarily for e-commerce businesses, and you can learn which products are the best performers, successful promotional campaigns, and which segments have the highest conversion rates. You can also dig into metrics like item views, add-to-cart events, and checkout behavior to optimize the customer journey and boost sales.
Retention Report
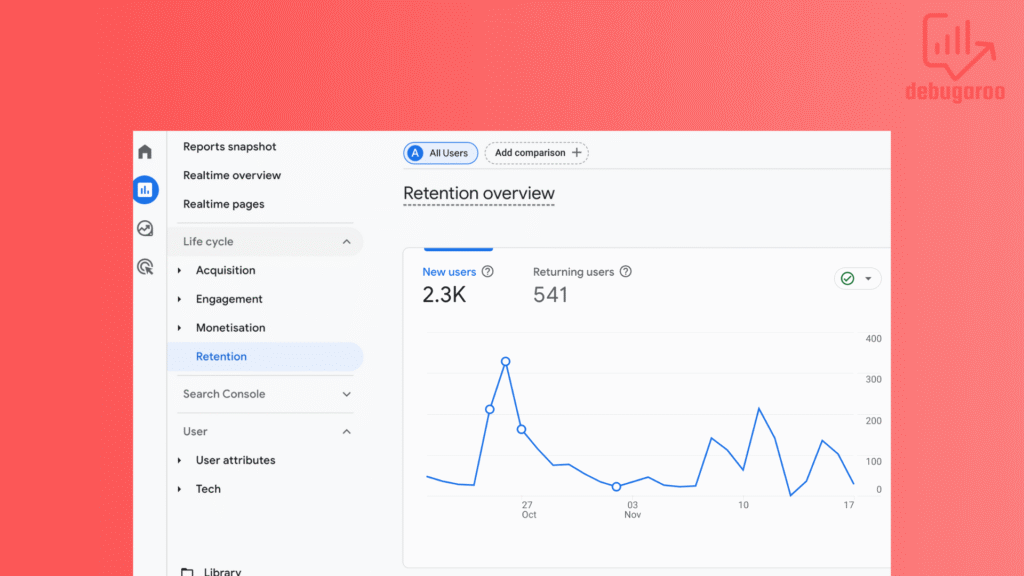
Measures user loyalty by showing how often visitors return to your website over time.
It provides a valuable understanding of user behavior, highlighting metrics like new users, returning users, and engagement. You also get cohort analysis of user engagement and user retention.
Understanding how long users stay engaged and what causes them to return can help you make more data-driven decisions to increase user loyalty and lifetime value(LTV).
Exploration Reports
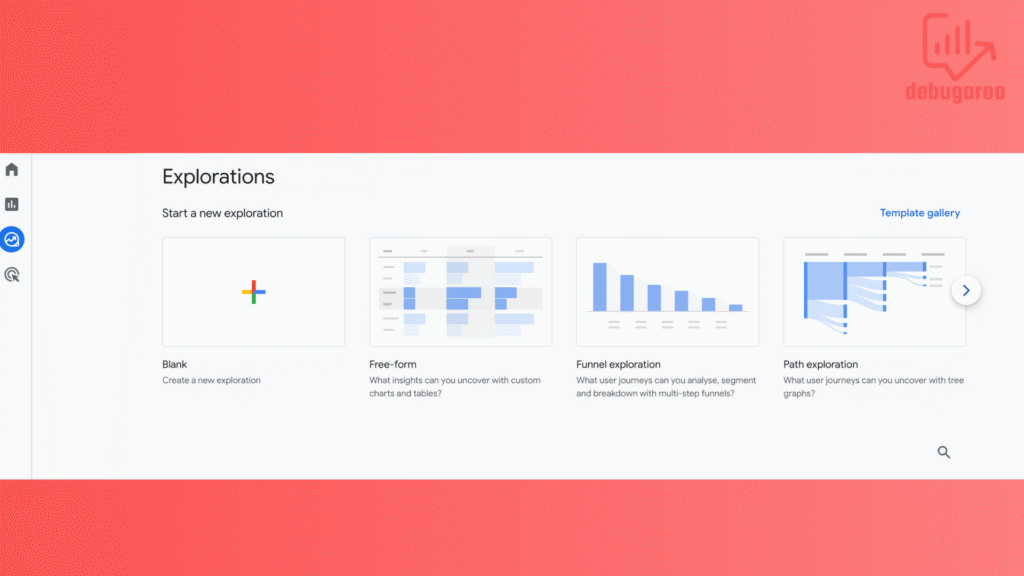
Free-form explorations – Allows you to build custom tables and visualizations and explore data according to your requirements.
Funnel exploration – Helps you analyze user journeys, making it easy to identify drop-off points and optimize conversion paths.
Path exploration – Visualizes how users navigate your website and discover common behaviors and unexpected patterns.
These exploration reports provide more advanced insights than standard reports, helping you make more informed decisions.
We could dive deeper into several other exploration reports, but that is for another article.
Finally…
Thank you for surviving this long. You made it through the jungle of GA4 setup and tracking! It might feel like drinking from a firehose, but remember; every analytics pro was once a beginner. Now it’s your turn to shine. Take what you’ve learned here and start tracking like a boss.


